Avoid the black hole of investing
(MoneyWatch) Small-cap growth stocks have been euphemistically called "the black hole of investing." The reason is that they have produced the lowest returns of any of the major U.S. stock asset classes, even though they theoretically should perform much better. The following table shows both the annualized returns and the annual standard deviations for the period 1927-2011.*
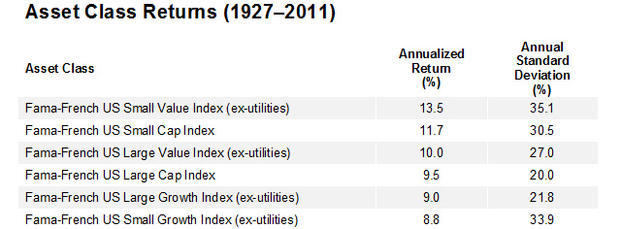
Basically, the data lines up the way we would expect -- the riskier the asset class, the higher the returns -- with one glaring exception. Small-cap growth stocks should produce higher returns than large-cap growth stocks and large-cap stocks in general. Yet they've produced the lowest returns. In fact, while other subsets of small-cap stocks have outperformed large-caps, the performance of small-cap growth stocks has been so poor that the small-cap premium disappears completely.
- What's wrong with small growth stocks?
- How to be a successful investor
- Do value stocks outperform growth stocks?
Their performance has been so poor that for the 43-year period 1969-2011, U.S. small-cap growth stocks returned just 6.1 percent, underperforming small-cap stocks by 4.2 percent a year and small-cap value stocks by 6.5 percent a year, and even underperforming 20-year Treasury bonds by 2.7 percent a year. Like the momentum effect, this is an anomaly and a problem for those who believe in efficient markets.
This may seem like an anomaly on the surface, but similar findings have been found for penny stocks, stocks in bankruptcy and IPOs -- all have experienced lower returns than we would expect. (This is referred to as the "lottery effect.") The reason is that investors are willing to accept low average returns in exchange for the possibility of getting some extremely positive outcomes. While most of the stocks with these characteristics should experience lower-than-average returns, investors jump into them, hoping to find the next Google (GOOG) or Apple (AAPL).
Thanks to the research team at Dimensional Fund Advisors (DFA), we find that the "black hole" exists in 23 developed international markets as well. For the period November 1990-March 2011, they found that the most extreme small growth stocks (the smallest, most growth-oriented ones) were the poorest performing, returning just 0.8 percent above one-month U.S. Treasury bills. They underperformed the largest, most growth-oriented stocks by 2.8 percent per year and the smallest most value-oriented stocks by an astounding 12.6 percent a year.
This presents a dilemma for investors. On one hand, their portfolio returns may be better off excluding such stocks. On the other hand, you sacrifice diversification by leaving an entire asset class out of your portfolio. DFA's research shows that excluding the most extreme small-cap growth stocks, which make up 12 percent of the small-cap stock universe, small-cap stock returns over the period 1975-2011 would have risen from 16.7 percent to 17.6 percent. International small-cap stocks showed similar results, rising from 7.2 percent to 8.1 percent for the period 1995-2011.
Summarizing, the historical evidence presents a compelling case that small-cap growth stocks earn low average returns and that, by excluding extreme small-cap growth stocks, you can improve the expected performance of a portfolio while still maintaining broad diversification within the small-cap space.
Money image courtesy of taxbrackets.org.
* Table has been updated to correct returns of large-cap and large-cap growth indexes and standard deviations of large-cap value, large-cap and large-cap growth indexes.